Museum clarity, made effortless.
Uncover how Tree’d performs across your museum in a powerful (yet simple) interface. See visitor trends, language mix, exhibit popularity, and key engagement metrics — all updated automatically.
Core
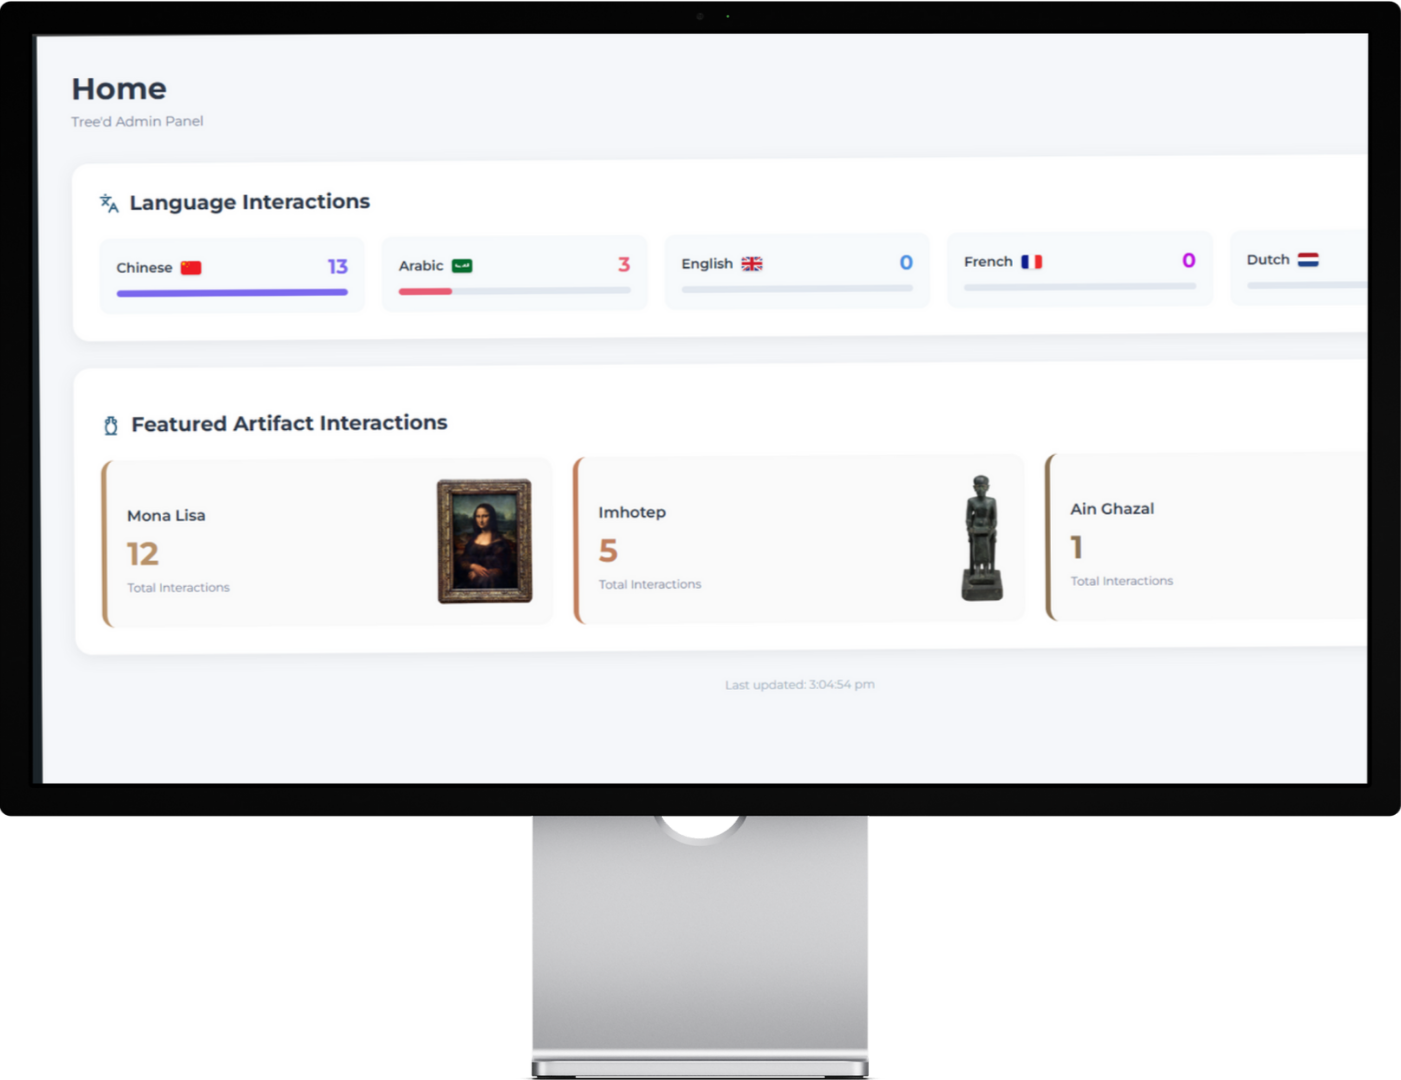
A clearer way to see your museum.
Museums host constant movement and curiosity. The Dashboard captures that rhythm and turns it into a clear picture: what people listen to, where they spend time, which stories resonate, and how Tree’d supports them throughout the day. It’s a quiet companion to your museum’s operations, always updating itself in the background.
Clear insight.
Quiet operation.

Insight
Discover your museum’s rhythm
Museums shift constantly throughout the day — quiet moments, crowded galleries, language patterns, and bursts of curiosity that are hard to see in real time. The Dashboard makes sense of that motion by revealing patterns that usually go unnoticed. It helps teams understand the flow of each day, spot needs early, and make small decisions that improve the visitor experience without changing the character of the museum.


Metrics
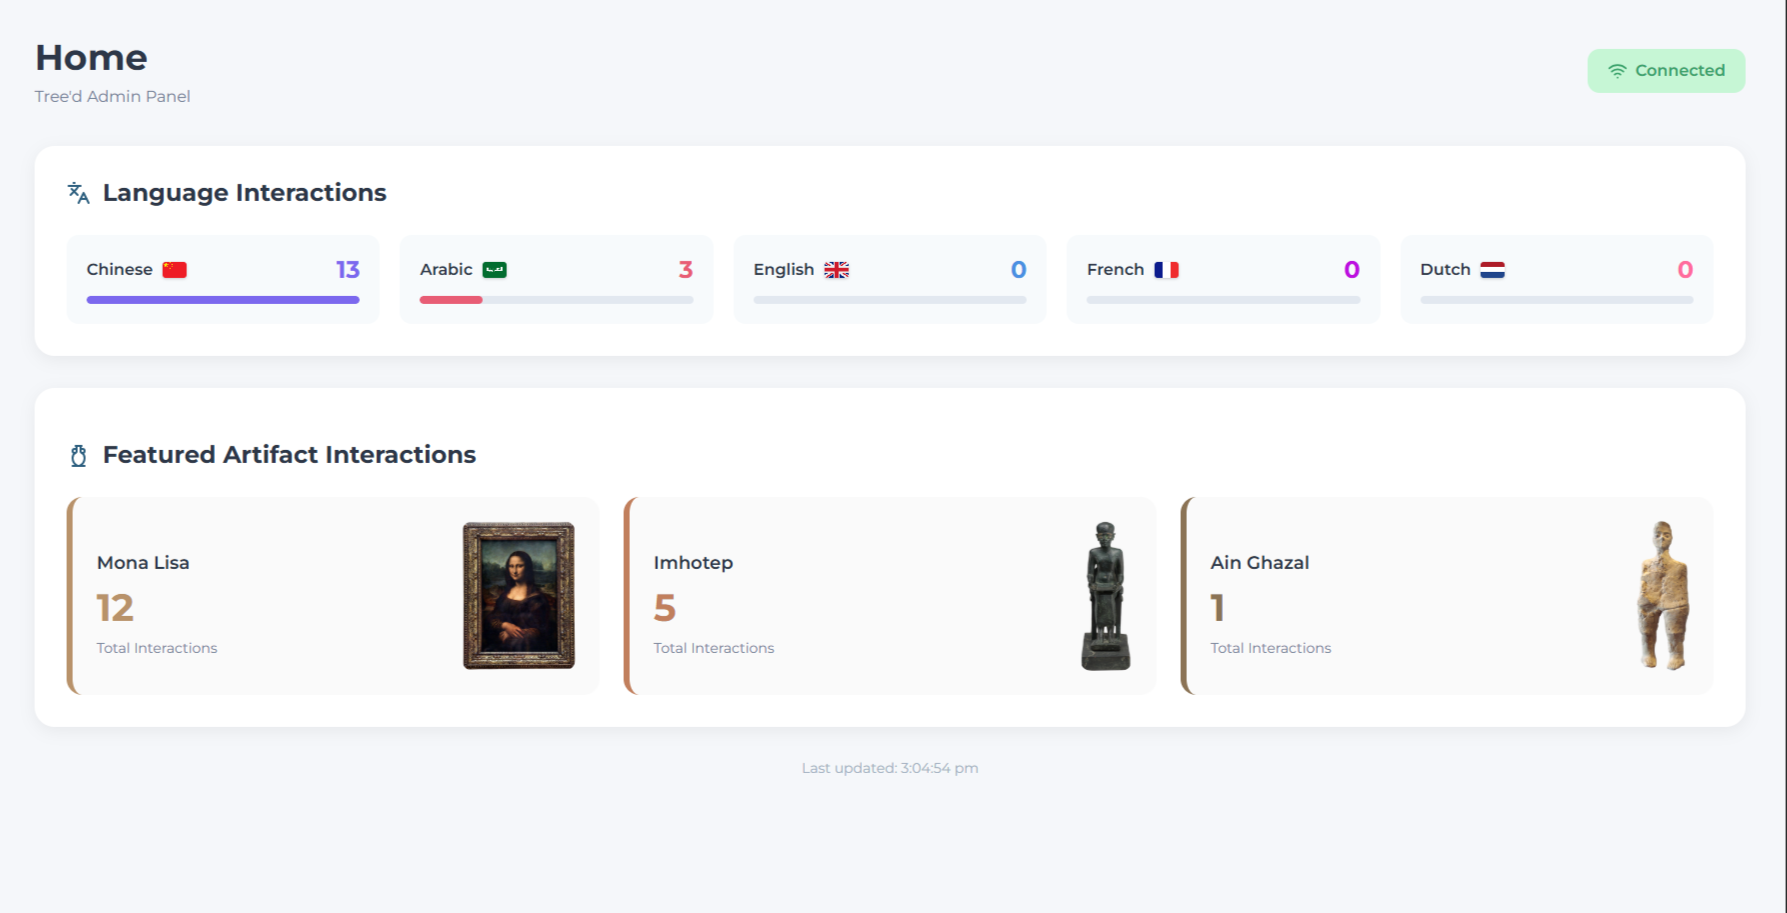
Consolidated insight.
The Dashboard brings together every signal Tree’d collects into a single, organized view. These metrics are presented clearly and always anonymously, giving museums a practical understanding of how visitors explore, learn, and move through their spaces.
-
Popular paths through the museum
Heatmap of gallery movement
Dwell time per visit and per artifact
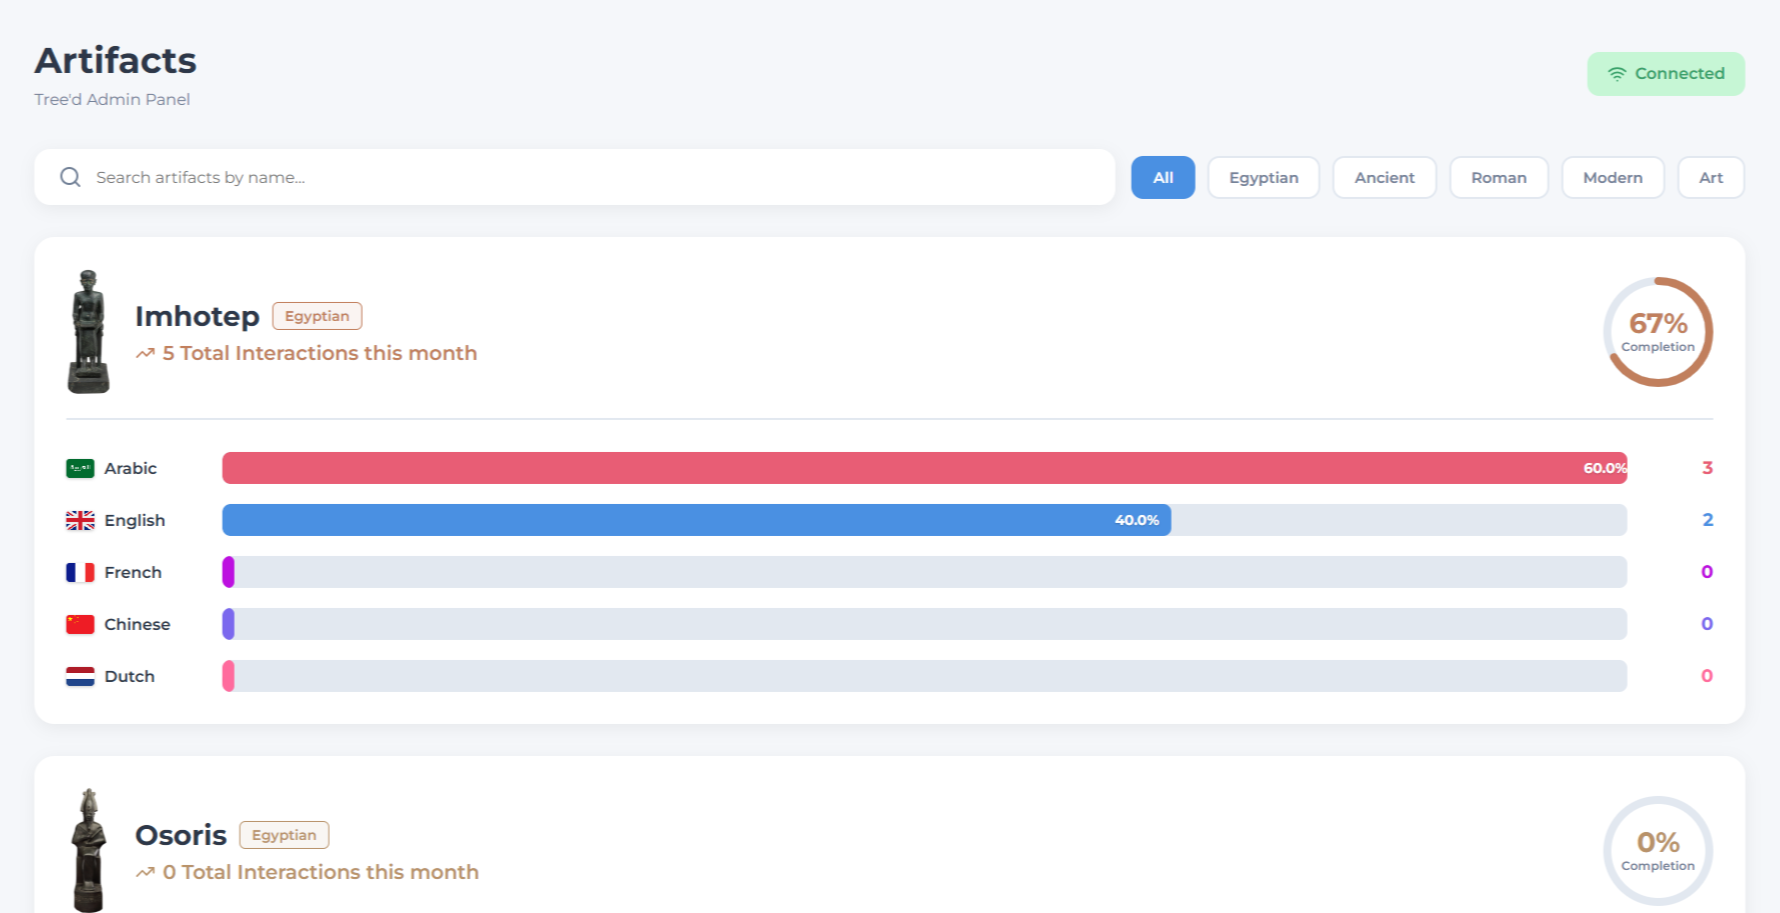
Popularity of specific themes and collections
-
Audio track completion rates
Follow-up questions asked to the AI model
Question categories and themes
Number of scans per tour
-
Language selection breakdown
Daily/weekly/monthly shifts
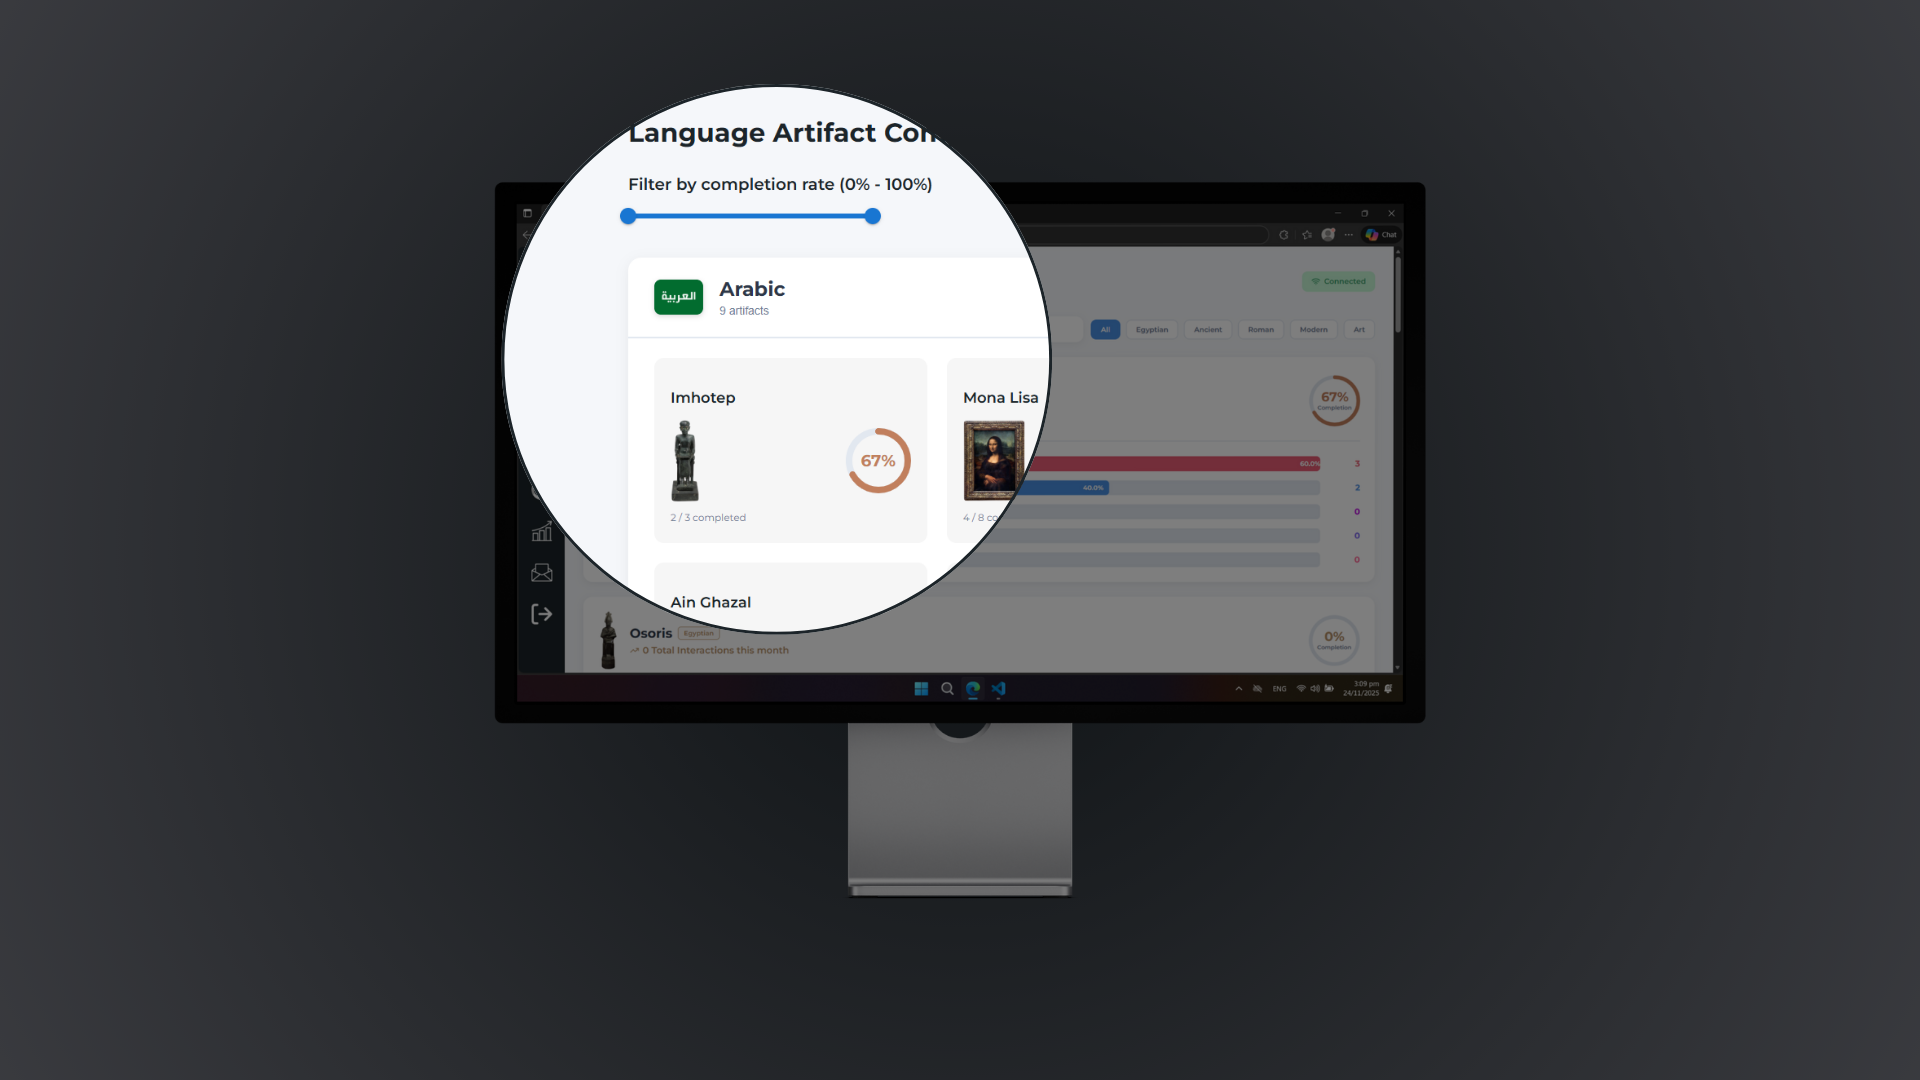
Popularity of certain artifacts, themes, and collections by each language
-
Number of Handsets currently in use
Battery levels
Charging status
Uptime and stability
Operation
Simple, Powerful.
The Dashboard updates itself automatically through the Tree. No setup, no maintenance, no manual syncing — just a clear view of what’s happening across your museum. Staff can check availability, performance, and visitor flow at a glance.
Privacy
Zero privacy concerns.
Tree’d never collects personal data or stores voice recordings. All insights are anonymous and aggregated, running through a secure local database infrastructure. The Dashboard gives you clarity without compromising privacy.